Method Test Prep is proud that over 1,000 schools, community organizations and independent counselors worldwide use our online program to help students prepare for the ACT and SAT. One thing that sets Method Test Prep apart from other companies is the continual revision process of our software: we are always making updates and changes to best reflect trends in standardized testing and to meet the needs of the students and educators who use our program.
One recent change was to the format of the teacher home page. All the information you are used to seeing is still there, but we've reorganized it a bit. The following is a refresher course in how to use the teacher homepage. We hope you find it helpful.
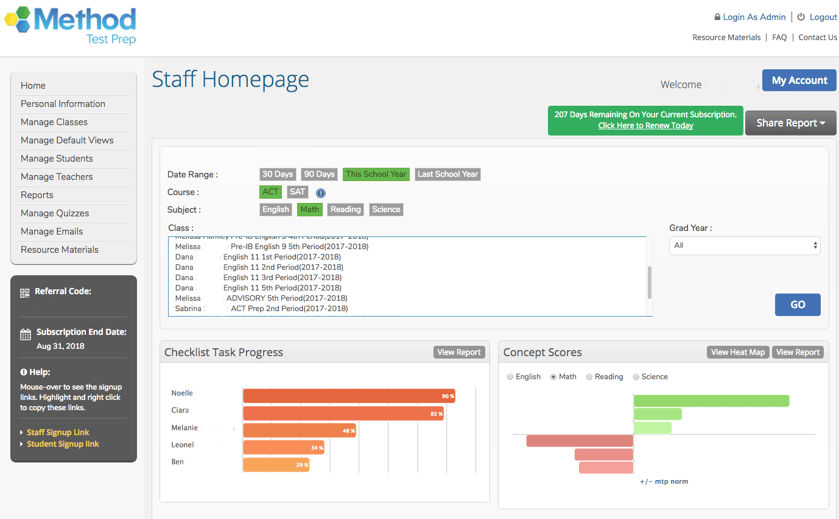
To help you access information about your classes more easily, we've moved the class selector window to the top of the page. Remember that you can use the "Date", "Course", "Subject", "Grad Year", and "Class" filters to restrict the data you see to exactly what you're looking for at that moment. Not sure how to assign your students to classes? The Teacher's User Manual can show you how; alternatively, you can contact us.
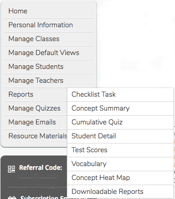 |
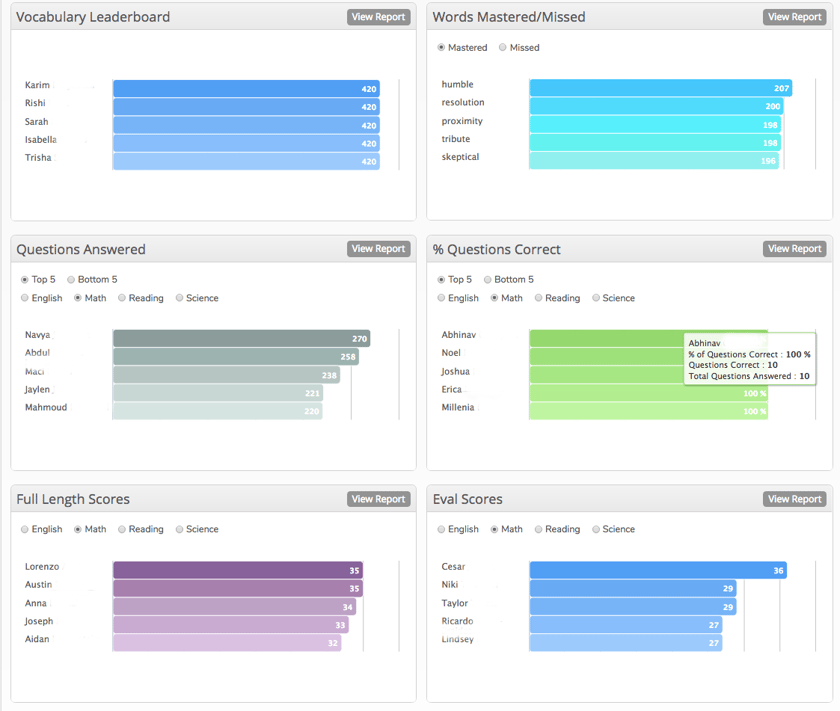
The middle of the homepage contains "teasers" of the data you can view in our reports. You can learn more by going to the gray navigation bar and clicking "Reports", or you can click "View Report" on any of the teaser images. These reports make it easy for you to track your students' progress. The Teacher's User Manual explains each report in detail. |
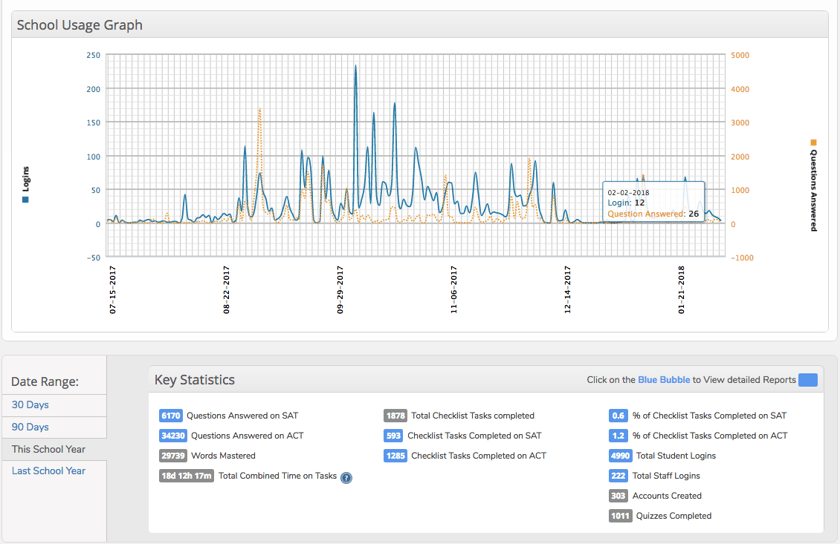
The bottom of the homepage shows your "School Usage Graph" as well as a range of useful "Key Statistics". The graph has two data points for every day: total logins in blue, and total questions answered in orange. The statistics provide summary data showing details about the work your students have been doing. This part of the page is a great way to track usage at a glance. More helpfully, the graph and the statistics reflect the choices you made with the limiters at the top of the screen, so they are a great way for a teacher or administrator to compare the performance of one group of students to that of another group. Also note that you can now view the data for the current school year (July 15th through the current date), the previous school year, the last three months, or the last month. Many of our schools asked for a way to easily compare year-to-year usage, and we are glad to be able to provide it right on the homepage.
As always, please contact us if you have any questions. Thank you for using Method Test Prep's online program. We look forward to continuing to provide you with the best ACT and SAT preparation materials!