Nerdpost 2: The Return of the Concordance Tables

Back in August, I wrote the inaugural Nerdpost, inspired by the College Board’s release of the scoring scales for the four official New SAT exams that had been published. If you haven’t read that, you may want to go back and have a look. If you don’t, the crux of the post is simple: by comparing the scales on the “old” SAT with those of the New SAT, I showed that students could achieve the same scaled score (out of 800) on comparable sections of the two exams by answering a significantly lower percentage of questions correctly on the New SAT section. This seemed to suggest that the New SAT was designed to be a more difficult exam, and that the College Board was acknowledging as much.
 I did, however, mention one caveat: at the time of writing, there was no way to confirm whether, say, a 500 on the Math section on the old SAT was equivalent to a 500 on the Math test on the New SAT. This was because the College Board had yet to publish concordance tables, which are charts that equate scores across exams scored on different scales.
The first administration of the New SAT is still a few weeks away from its March debut, and the College Board has already made it clear that official concordance tables for the SAT won’t be published until May of this year. However, with the recent release of PSAT scores came concordance tables comparing the old version of the PSAT to the New PSAT, which was aligned to the New SAT. It is here from which we can gain a little insight into how old and New SAT scores will square.
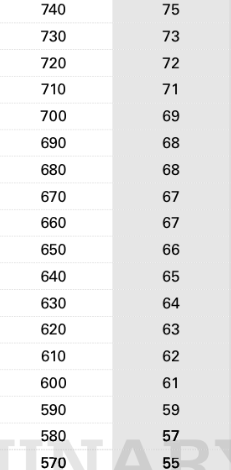
First, let's take a look at the math scales. I've selected a portion of the concordance between the New PSAT (left column) and the pre-2015 PSAT (right column) math sections, shown below.

Except for the scores at the very top of the scale (which couldn't possibly be equal, since the maximum score per section on the New PSAT is 760, whereas the maximum section score on the old PSAT was an 80, which translated to an 800), the closeness of the scales is striking. Only when we enter the range of sub-500 scores does the concordance show more than a 30-point deviation between the two scales. This, of course, is still within the College Board's own margin of error, which was +/– 40 points per section on the old PSAT (on a scale of 800), and +/– 30 points per section on the New PSAT (assuming a scale of 760, which does align with the eventual 800-scale of the New SAT). As we move further down the scale, we see the old PSAT scores start to become significantly lower than the ones they correspond to on the New PSAT scale. For example, we can see that if a student achieved a 23 (or 230) on the old PSAT, this would be equivalent to having achieved a 330 in the New PSAT, indicating that, statistically, the new exam is 100-points' worth more difficult for that student. This is just about as extreme as it gets, and as we can see, most of the scores students generally see as good goals to hit (500s-700s), the scales are quite similar.
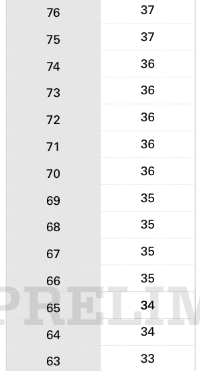
We should also have a look at Reading. Keep in mind that on the old test, Critical Reading was a standalone section out of 800. On the New PSAT, the Reading test score out of 38 (or 380) combines with the Writing & Language test score (also out of 380), to make an "Evidence-Based Reading and Writing" score out of 760. This means that to directly compare old PSAT and New PSAT Reading scores, we have to double the Reading test score of the New PSAT so that it alone is out of 760. This is okay because we are justified in making the assumption that the Reading and Writing & Language sections make up equal "halves" of the New PSAT's Evidence-Based Reading and Writing score. Below, you can see a selected portion of the relevant concordance table.

If we double the scores in the right-hand column and add a zero, we can see something very similar to what we observed on the math scales: the scaled scores differ at most by only 30-50 points for most score ranges in the scale. Again, this is within the College Board's own range of expected score variability.
Taken alone, all this would make for a relatively boring conclusion: the PSAT was restructured and the scaled scores are pretty much similar to one another. But remember Nerdpost number 1, which showed that assuming very similar scaled score alignment would mean that students could get many fewer questions correct on the New PSAT than would have been necessary on the old test, and still get "same" score. What we have here, then, is a preliminary confirmation that this is accurate. The key word here is preliminary, which appears as a watermark on all of the concordance tables published thus far. We also can't assume that PSAT concordance will be equivalent to SAT concordance. Nevertheless, I happen to think this is a fair indication of the final scenario: that the New SAT is a genuinely more difficult exam, that the College Board is aware of this, and that the students who take the exam can thus get away with a lesser proportion of correct answers to achieve the score they would have received on the old (P)SAT.


